Engineering Pro Guides is your guide to passing the Mechanical & Electrical PE and FE Exams
Engineering Pro Guides provides mechanical and electrical PE and FE exam technical study guides, practice exams and much more. Contact Justin for more information.
Email: contact@engproguides.com
EXAM TOOLS
Pressure Enthalpy Diagram
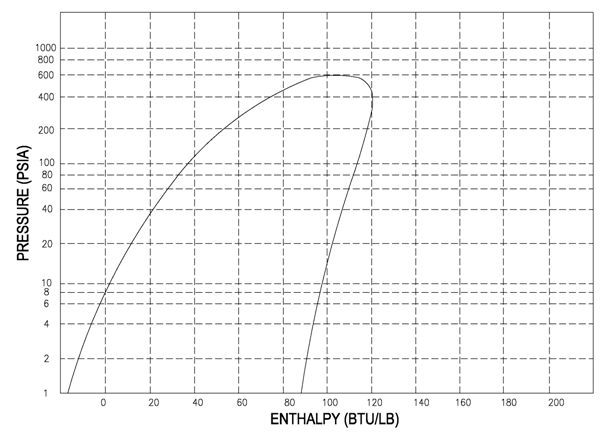
This diagram describes the relationship of pressure and enthalpy of a select refrigerant. In order to properly understand this diagram, it is best to go through the vapor compression cycle on a P-H diagram.
Understanding the P-H Diagram
On the P-H diagram, pressure is indicated on the y-axis and enthalpy is indicated on the x-axis. Typically enthalpy is in units of Btu/lb and pressure is in units of pounds per square inch (psi). The upside down U figure shown on the diagram designates the points at which the refrigerant changes phase. The left vertical curve indicates the saturated liquid curve and the right vertical curve indicates the saturated vapor curve. The region in between the two curves describe refrigerant states that contain a mixture of both liquid and vapor. The locations to the left of the saturated liquid curve indicate that the refrigerant is in liquid form and locations to the right of the saturated vapor curve indicate that the refrigerant is in vapor form. The point at which the two curves meet is called the critical point. The importance of this point is that at any point above, no additional pressure will change the vapor into a liquid. A simplified pressure-enthalpy diagram is shown below, describing this information.

The curves break up the diagram into three regions (1) Liquid, (2) Vapor and (3) Mix.
(1) Liquid Region: The liquid region is also known as the sub-cooled region. In this region there are vertical temperature lines, which increase as enthalpy is increased. Figure 8 is a simplified P-H diagram illustrating the constant temperature lines.
(2) Vapor Region: The vapor region is also known as the super heated region. In this region there are vertical temperature lines, which increase as enthalpy is increased. Refer to Figure 8. There are also lines of constant entropy, which are also important. Entropy is the measure of the amount of disorder in the system.
(3) Liquid-Vapor Mix Region: In this region, the P-H diagram shows horizontal temperature lines, which indicate constant temperature. The mix region is the phase change region, where any addition of enthalpy will cause additional liquid to vaporize instead of raising the temperature. Figure 8 illustrates the horizontal temperature lines in the mix region. There are also upward sloping curves which indicate quality. Quality is a measure of the ratio of vapor mass to total mass. For example quality of 0.1 or 10%, which is located near the saturated liquid line, describes points that have 10% vapor by mass. The 0.9 or 90% line, which is located near the saturated vapor line, describes points that have 90% vapor by mass. The previous figure, Figure 7, indicates the quality lines.

The x-y axes of the P-H diagram are the pressure lines running from left to right. The enthalpy lines are the vertical lines. The skeletal graph shown below shows the pressure-enthalpy lines.

Refrigeration Cycle
One of the most important skills needed for the professional engineer in the HVAC and Refrigeration field is navigating the refrigeration cycle on a pressure-enthalpy diagram. The following sections will show each specific part of the refrigeration cycle on the pressure-enthalpy diagram and it will also highlight the important points and calculations needed.
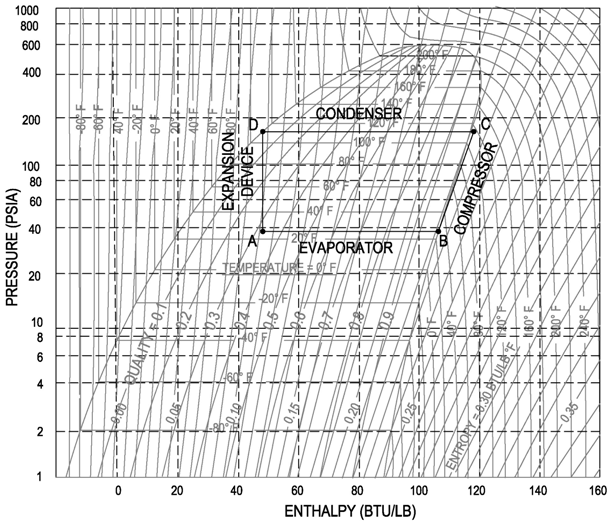
Throughout this explanation the refrigerant R-134a is used as an example. It is recommended that the engineer get a copy of the P-H diagram for R-134a and the other common refrigerants. These diagrams can be found in the ASHRAE Fundamentals book. A sample R-134a diagram is shown below, with a sample refrigeration cycle, identifying (Step 1) Evaporator, (Step 2) Compressor, (Step 3) Condenser and (Step 4) Expansion Device.

STEP 1: EVAPORATOR
The refrigerant entering the evaporator is a cold, partial liquid-vapor mixture. The operating pressure and temperature of the evaporator is called the suction pressure and suction temperature. The suction line is the piping that routes refrigerant gas from the evaporator to the compressor. It is important to note that in the mix region, the pressure and temperature are dependent variables.
For example, if a compressor operates at a suction pressure of 36.8 psia, then the corresponding evaporator pressure is 36.8 psia and the corresponding evaporator temperature is 25 °F, see below figure for points A and B (Values are for Refrigerant R-134a). If the compressor operates at a suction pressure of 49.7 psia, then the corresponding evaporator pressure is also 49.7 psia and the evaporator temperature is 40 °F. See below figure for points A' and B'(Values are for Refrigerant R-134a).

The evaporator moves the refrigerant from point A (partial liquid-vapor mixture) to point B, a fully saturated vapor refrigerant. As the evaporator transfers heat to the refrigerant, there is no gain in temperature, since all the heat is used to convert the remaining liquid to a gas. In an ideal evaporator, there is just enough heat transfer to convert all the liquid to gas and nothing more. Thus, the output of an ideal evaporator is 100% vapor at the same entering temperature, refer to figure below. In this figure, we see that as the refrigerant moves through the evaporator, the temperature remains the same and the percentage of vapor increases, until it reaches saturation at 100%.

Also introduced in the figure above is the term superheat. If additional heat were to be added to the 100% vapor refrigerant, then the heat would be used to increase the temperature and it is this increase in temperature that is called superheat.
In the figure below, an evaporator with 15 °F superheat is shown. The refrigerant reaches 100% vapor prior to leaving the evaporator. All the additional heat from this point is used to increase the temperature of the refrigerant until it reaches a temperature of 40 °F. This refrigerant has a superheat of 15 °F because the final temperature is 15 degrees passed the saturation temperature of 25 °F. It is important to note that the pressure remains constant throughout the evaporator.

On the pressure-enthalpy diagram superheat is shown as horizontal movement along the suction pressure line passed the 100% vapor curve. The figure on the following page shows the difference between 0 °F and 15 °F superheat. Point B is the 100% vapor point at a constant evaporator/suction pressure of 36.8 psia and a temperature of 25 °F. Point B' results from additional heat/enthalpy added to the refrigerant. The refrigerant moves from point B to point B', where the resulting temperature is 40 °F.

STEP 2: COMPRESSOR
The compressor is characterized by the refrigerant suction and discharge conditions. Horizontal lines are drawn across the refrigerant's pressure enthalpy diagram for the suction and discharge pressures. Then the incoming temperature of the compressor, as determined by the leaving temperature of the evaporator, is used as the starting point of the compressor, as shown by point B' on the figure below. The compressor then increases the pressure of the refrigerant up to the discharge pressure. Compression occurs at constant entropy, also known as isentropic compression. Therefore the intersection of the constant entropy line and the discharge pressure line will identify the final condition of the refrigerant gas leaving the compressor, as shown by point C' in the figure below.

A common skill, that is required of a professional engineer, is to determine the work done by the compressor. This work is shown in the figure above as the difference between the compressor entering enthalpy (H1) and the leaving enthalpy (H2). The equation to determine the work of the compressor is shown below. This equation multiples the refrigeration flow rate by the change in enthalpy between the discharge and suction conditions.

The x-y axes of the P-H diagram are the pressure lines running from left to right. The enthalpy lines are the vertical lines. The skeletal graph shown below shows the pressure-enthalpy lines.

STEP 3: CONDENSER
The refrigerant entering the condenser is now a hot, high pressure refrigerant gas. The condenser is shown on the pressure-enthalpy diagram as a horizontal line. This horizontal line is a line of constant pressure, corresponding to the discharge pressure of the compressor. The condenser proceeds from right to left in the following three steps:
(1) The superheated gas cools down to saturation temperature [C' 160 °F to D' 140 °F]. Cooling takes place as heat flows from the hot refrigerant gas to the condenser cooling medium.
(2) Next, the 100% saturated vapor at D' is converted to 100% saturated liquid at D''. Heat is lost to the condenser cooling medium as the vapor is condensed to a liquid.
(3) Finally, the 100% saturated liquid is sub-cooled from D'' to D'''[140 °F to 115 °F]. In an ideal condenser, no sub-cooling occurs. Once the refrigerant is a fully saturated liquid, any additional heat loss results in a decrease in temperature. This cooling of the saturated liquid is referred to as sub-cooling. In this example, the refrigerant has gone through 25 °F of sub-cooling and resulted in a sub-cooled temperature of 115 °F.

A common question is to determine the heat expelled by the condenser, which is shown in the figure above as the difference between the condenser entering condition (H2) and the leaving condition (H4). The equation to determine the net condenser effect is shown below. This equation multiples the refrigeration flow rate by the change in enthalpy between the entrance and exit of the condenser.

The x-y axes of the P-H diagram are the pressure lines running from left to right. The enthalpy lines are the vertical lines. The skeletal graph shown below shows the pressure-enthalpy lines.

STEP 4: EXPANSION DEVICE
The expansion device is the counterpart of the compressor. Similarly, the expansion device is characterized by the suction and discharge pressures. Horizontal lines are again drawn on the refrigerant's pressure-enthalpy diagram. The input condition of the expansion device is determined by the condenser output conditions.
There are two entering conditions to the expansion device shown on the following diagram. The first situation has 0 °F of sub-cooling [D’’] and the second situation has 15 °F of sub-cooling [D’’’].
The expansion device expands the high pressure refrigerant liquid adiabatically to a low pressure liquid-vapor refrigerant mixture. Adiabatic expansion indicates that there is no change in enthalpy and is characterized by a downward vertical line as shown on the below graph.
Note on the graph below as the refrigerant moves from point D to point A, the refrigerant moves from the liquid phase of the graph to the vapor-liquid mixture region. The amount of gas that is formed during this expansion is called flash gas.
